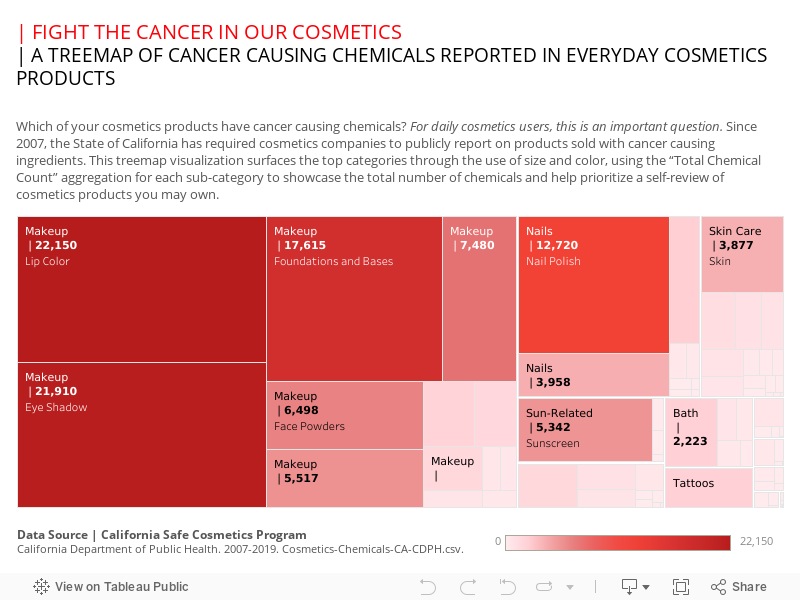
Visualizing Cancer Causing Chemicals in Cosmetics
Treemaps display hierarchical, or “tree structured”, data, presented as a set of nested rectangles. Each branch is reflected in a parent-child rectangle, which is then tiled with smaller rectangles representing sub-branches. A child-leaf rectangle will have an area proportional to a specified aggregation for a dimension selected in the data model. Often the leaf nodes are colored to show a separate dimension of the data, in this case both color and size are represented by the “Total Chemical Count” aggregation.